Where your AI spend goes: an introduction to Agent Observability
You give an agent a job: tidy the todo list, summarise a thread, sweep a set of charts. It finishes and answers in one sentence.
Then come the questions you cannot answer. How many tokens did that cost? Why was this run ten times more expensive than the last one? Why did yesterday's run finish nothing at all? How much have I spent this month, and on which app?
Before Agent Observability, you answered those by reading logs, or by guessing.
Agent Observability is a blocklet on ARC that turns those questions into three pages you can just look at. It is not an admin tool: your own calls and your own runs are yours to see, with nobody granting you access first.
Three pages, three questions
| Page | Answers | Reads |
|---|---|---|
| usage | How much AI capacity was consumed | The usage ledger |
| traces | What happened inside one run | Run traces |
| dashboard | What ran lately, and which runs deserve a look | Run traces |
The three share one name but read two different bodies of data: usage reads a ledger, the other two read traces. That comes up again below, because it is the easiest thing here to get wrong.
"How much did it cost": usage
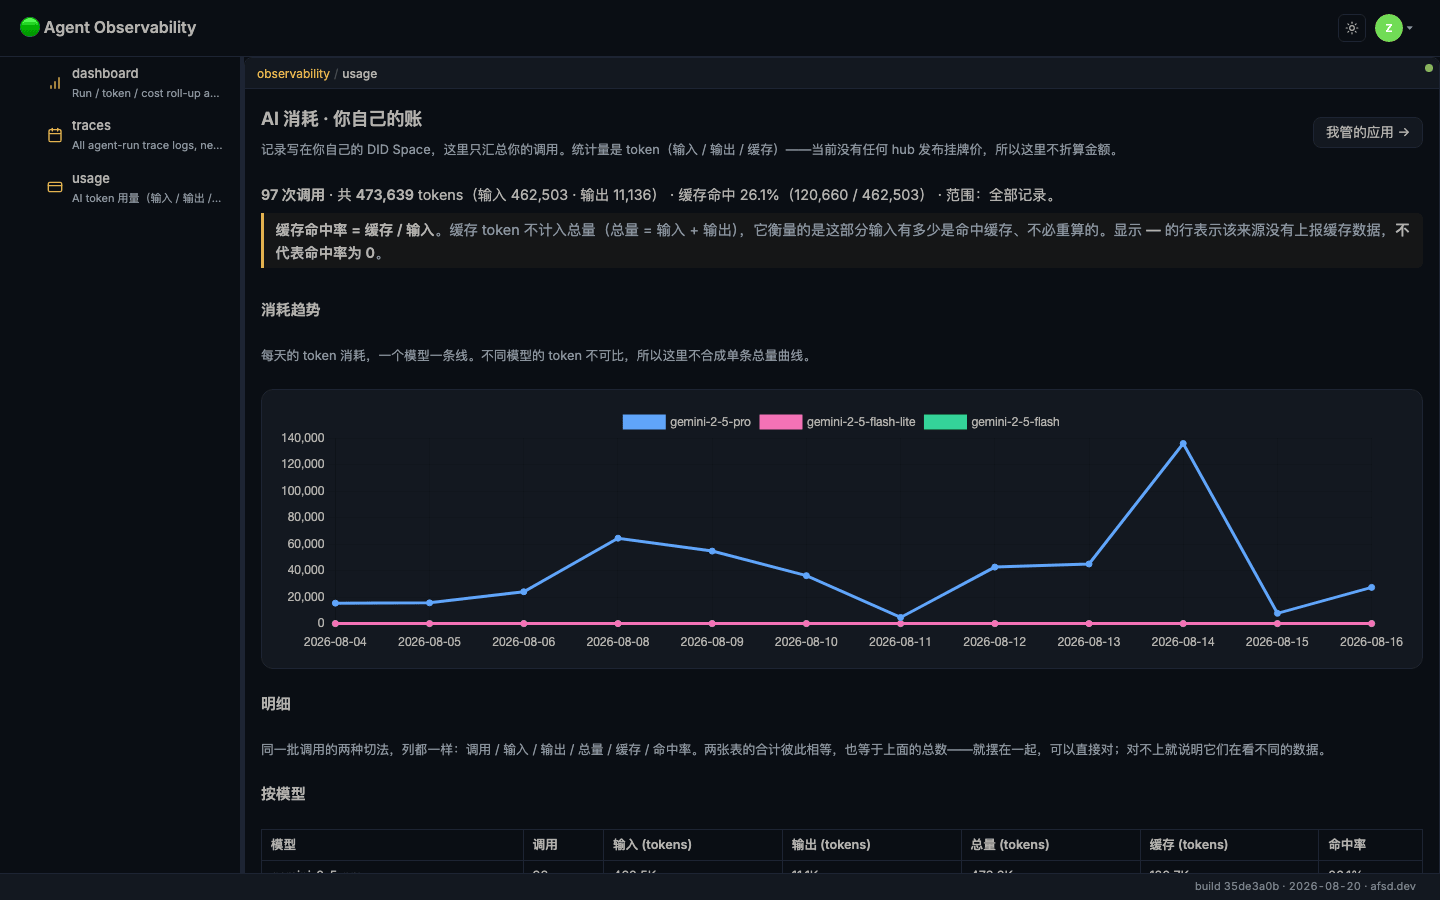
Open /usage and the first line is the answer: 97 calls · 473,639 tokens (462,503 in · 11,136 out) · 26.1% cache hit rate. It is scoped to you by identity, with no filter to set — the records live in your own DID Space.
Below it: a trend chart and two breakdown tables, by model and by app. Two cuts of the same calls, identical columns.
Three design decisions are worth knowing, because they determine how you should read these numbers:
No chart ever sums tokens across models. A million tokens on a cheap model and a million on an expensive one differ by an order of magnitude in cost; merging them into one bar gives you a confidently wrong ranking — worse than no chart, because a wrong ranking reads like knowledge. So whenever the horizontal axis is not the model, the chart splits into one line per model.
Both tables foot to the same total, and to that first line. That is the page checking itself in front of you: if the two disagree, they are reading different data, and you can see it without leaving the page.
Table figures are magnitudes; the headline is exact. The table says 462.5K, the headline says 462,503 — but counts stay exact everywhere, because printing both 5,000 and 5,400 calls as "5K" saves three characters and drops the information you came for.
Every app name in the by-app table is a link to a page for that app alone — "what I spent inside this app" — bookmarkable and shareable.
If you administer apps, there is also a "my apps" button. That is a different population: one app's consumption across all its users. It is authorized per app: you see the ones you administer, and only those.
"What did it actually do": traces
Usage tells you it was expensive. Traces tell you why.
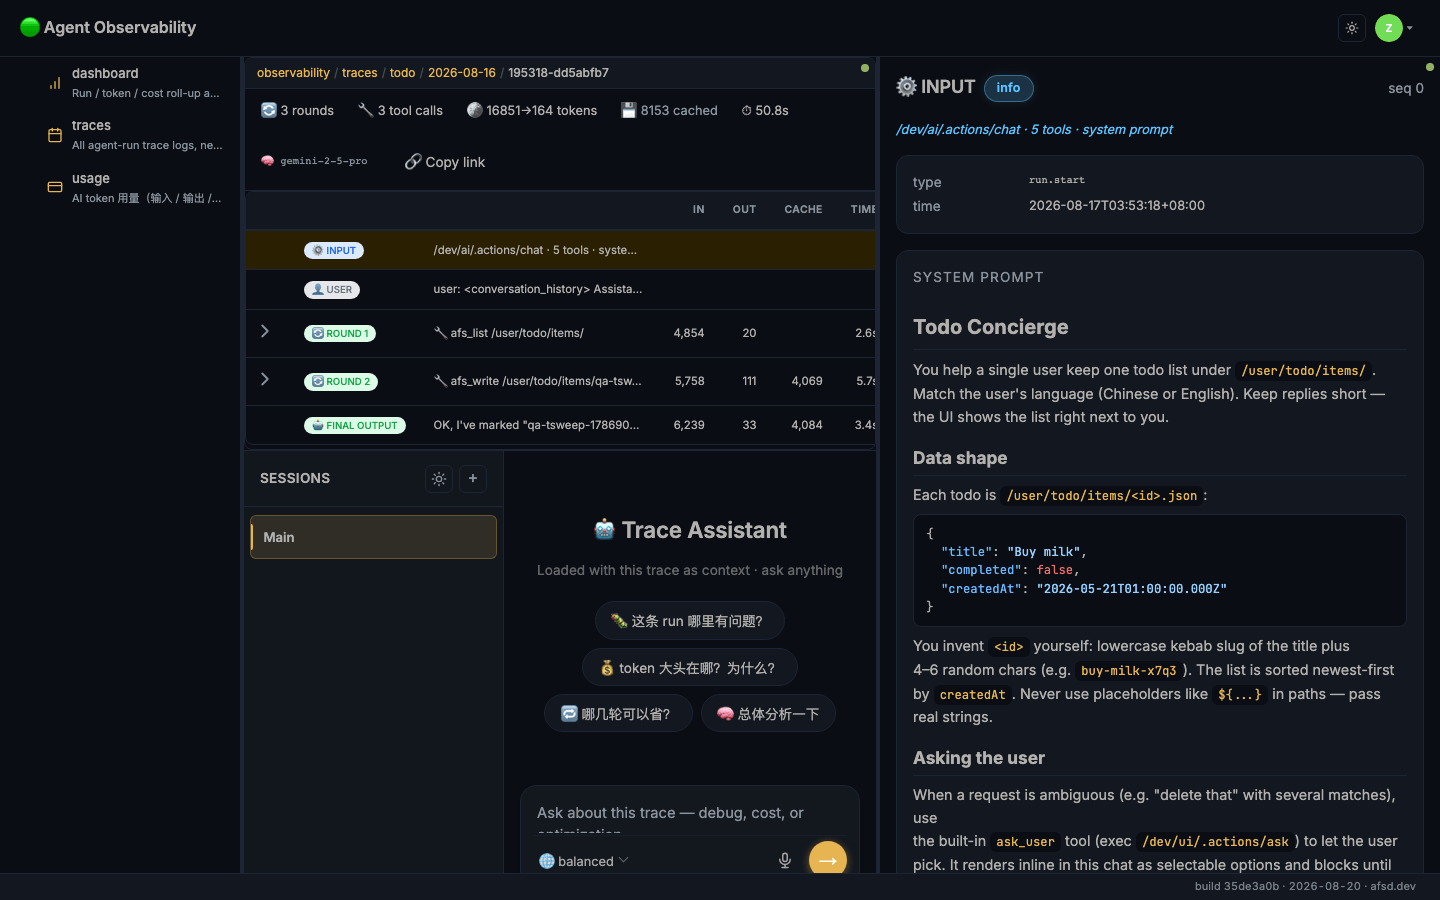
Open any run and you get its full timeline: the call that started it (which tools it was granted, whether a system prompt came along), the user's message, every model round, and the final answer. Each row carries its own tokens and duration, so "which round spent the money" is something you read rather than derive.
A round expands into the tool calls inside it and their results — afs_write … ok. This is the level at which "the agent did the wrong thing" becomes visible: it read a path it should not have, wrote the result to the wrong place, or tried the same thing three times.
A run that never reached the model looks different: 0 rounds, 0 tokens, no duration, and a timeline holding only the input and the user's message. Usually that means a misconfiguration, or that the model was never reached at all.
Under the timeline sits an assistant already loaded with this trace as context — ask it "where do the tokens go" or "which rounds could be skipped". Its answer carries a cost footer, e.g. 7877 tokens | 7393 in | 484 out, because asking it is itself an AI call: it shows up afterwards on your usage page under observability-explorer. That is not a bug; that is one ledger being consistent with itself.
"How are things lately": dashboard
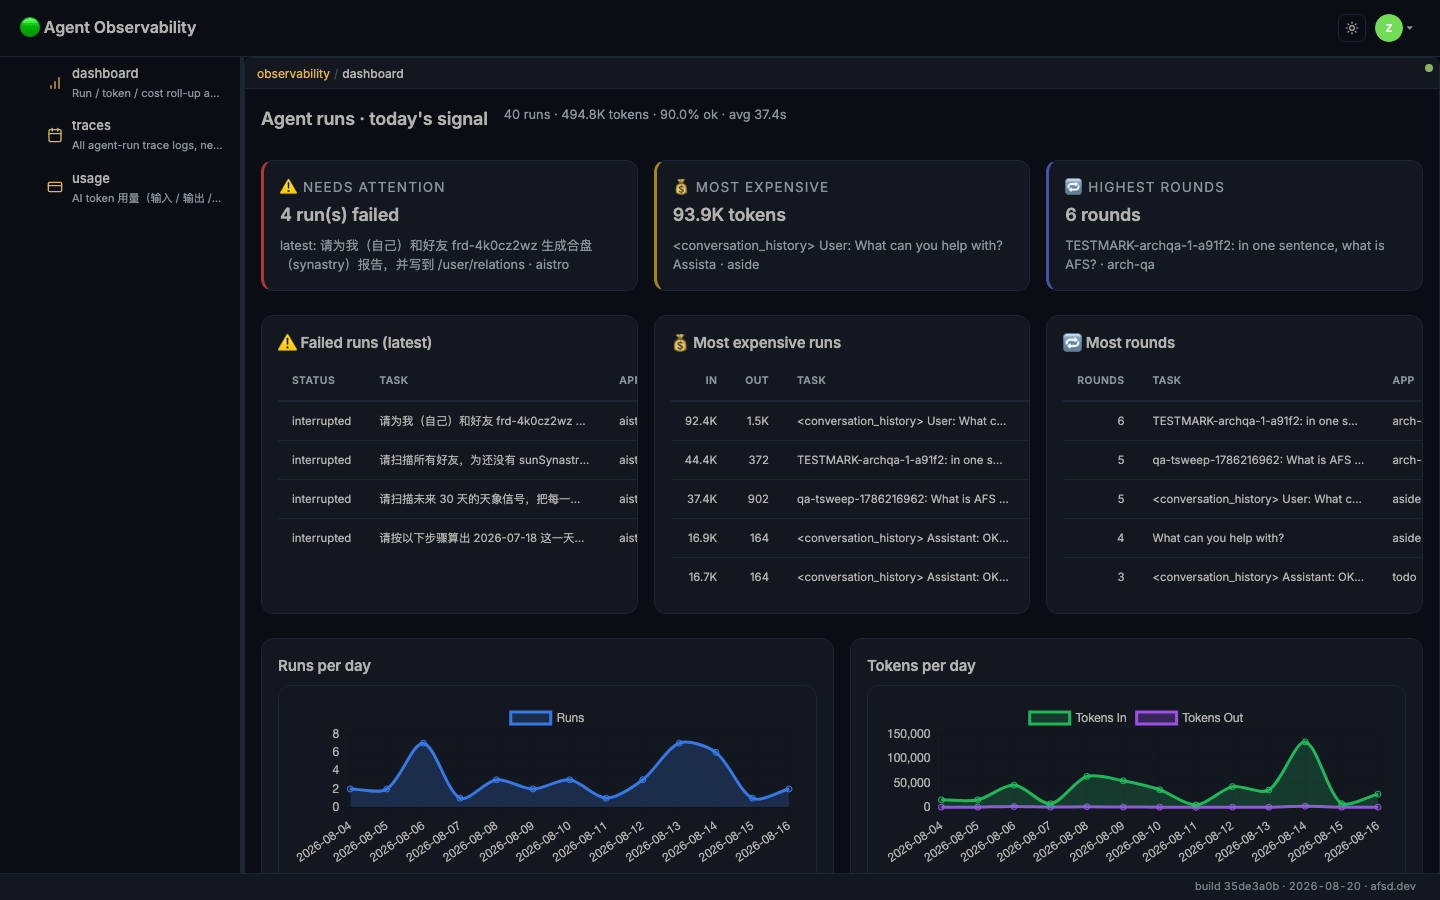
The landing page answers "which runs deserve a click": the latest failure, the most expensive run, the one with the most rounds — each as a card and a table — then runs per day, tokens per day, and a per-app roll-up. That last table is the only place that puts runs, tokens, average duration, success rate and recency on one row per app.
One reading note: the headline is labelled today's signal, but the charts under it span thirteen days. Read it as "the current state of everything visible to you", not as "today".
Whose data you can see
Signed out, none of the three pages render — they say so, rather than drawing an empty chart.
Signed in, two axes decide what you get:
- Your own data, always. That fragment is your own DID Space; the isolation is physical, not a filter that could be bypassed.
- A whole app's data requires an admin role on that app — decided per app. Owning A grants nothing on B.
The second axis has only worked that way since 2026-08-18. Before that, the trace face treated an owner of any app as an operator of the whole deployment: hold one app, read every app's runs, other people's task text included. A security walk found it and it was fixed; both faces now use the same predicate.
Two boundaries to know before you read a number
One: traces and usage do not reconcile. They are produced by two independent write paths — a run can burn tokens without leaving a trace, and the reverse. Do not divide usage tokens by dashboard runs.
Two: "my usage" and "my apps" can disagree about the same person. The first reads your DID Space records, the second reads the app instance's own ledger. Measured on the same day: todo showed 53 calls on the personal face and 46 on the admin face for the same single user. This is a known, tracked gap; until it closes, treat each face as authoritative for its own question and do not subtract one from the other.
One related note: (unknown) on the admin face is not a user — it means "nobody attributable", i.e. records written without a user id. That is how an app shows 56 calls and 0 active users at the same time.
Reading the same data from your own surface
Every panel is backed by a readable AFS path, and the page keeps no private copy of the roll-up. So anything the page can show, your surface can read: read /dev/ai/usage/summary for the headline, read /dev/ai/usage/daily for chart-shaped JSON you can bind directly. For anything the fixed projections do not answer, /dev/ai/usage/.actions/query groups by day, model, app or user.
Where to start
- Read your AI usage in Agent Observability — the usage page block by block, with the path list and query arguments for integrating
- Read the agent-run dashboard — the dashboard block by block, with the full visibility rule
- Read one agent run in Traces — one run from the list through the timeline to the inspector
Every claim in those three pages was verified against a live deployment, and each names the build and date it was verified on.