Use this page to read the AI usage face of the Agent Observability blocklet (blocklets/observability-explorer in the ARC monorepo): how many AI calls were made, by which model, from which app, and — if you administer apps — by which user.
Everything below was verified against the live deployment at https://observability-explorer.afsd.dev, build 35de3a0b, signed in as a registered test user on 2026-08-20. Your numbers, apps, and models will differ; the shapes, paths, and limits are the part to reuse.
This is the second walk. The first ran on build
400ce96(2026-08-15); in the five days since, three changes landed that alter how this face reads — breakdown tables and their合计footer switched to order-of-magnitude figures, the query action now rejects a misspelled top-level argument, and the admin portfolio picked up DID-Space-published blocklets. Every screenshot and number below was re-shot and rewritten against the new build rather than patched.
Two different things share the name "observability"
The blocklet has three sidebar sections, and they answer different questions from different data:
| Section | Route | Answers | Data |
|---|---|---|---|
| dashboard | /dashboard | What agent runs happened | Trace records |
| traces | /traces | What happened inside one agent run | Trace records |
| usage | /usage | What AI capacity was consumed | Audit ledger (/dev/ai/usage) |
This page documents usage only. Traces and usage never reconcile with each other and are not derived from one another — a run can consume tokens without producing a trace record and the reverse. If you are looking for "why did this agent do that", you want traces, not this page.
Open it
The usage face is two routes, one per population:
https://<your-observability-host>/usage          ← your own calls, across every app
https://<your-observability-host>/usage/admin    ← every user's calls, in apps you administer
Signed out, the app renders neither. It states the reason rather than an empty chart:
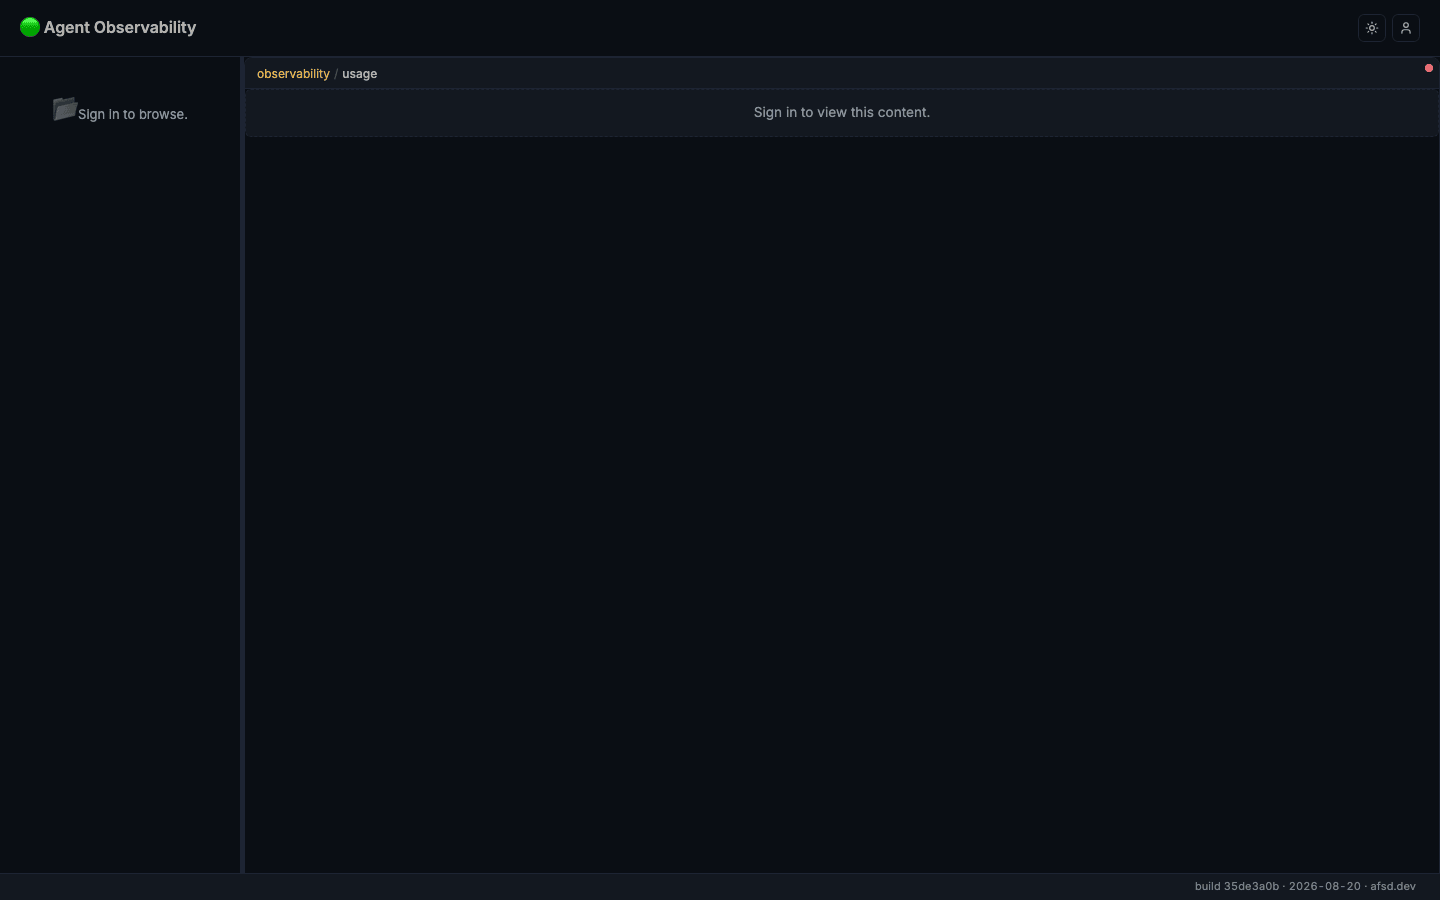
Sign in, and /usage is scoped to you by identity, not by a filter you have to set. The records live in your own DID Space; the page rolls up only calls attributed to you.
The personal face: /usage
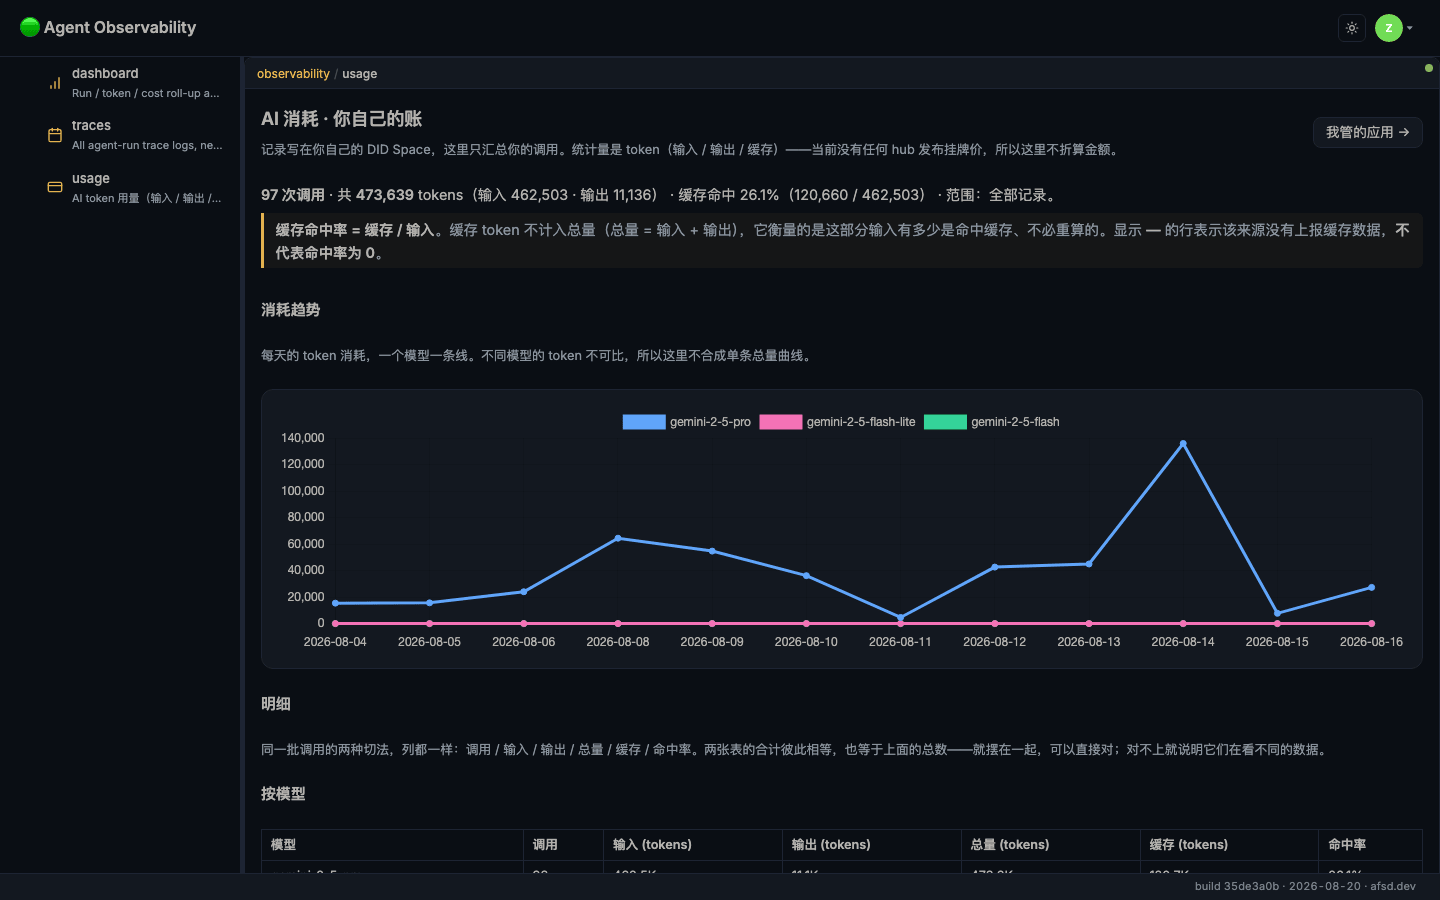
Read it top to bottom — each block qualifies the one above it. Every block is bound to a path under /dev/ai/usage/:
| Block | What it states | Bound to |
|---|---|---|
| Headline | Calls · total tokens (input + output) · cache hit rate with its denominator · time range | summary |
| Cache callout | That cached tokens are not an addend of the total, and that — means "not reported", not "zero" | same |
| 消耗趋势 (trend) | Daily tokens, one line per model | daily |
| 按模型 (by model) | Calls / input / output / total / cached / hit-rate per model | table-by-model |
| 按应用 (by app) | The same columns per calling app, plus a 模型构成 (model mix) column | table-by-caller |
Three properties of this page are deliberate and worth knowing before you read numbers off it.
No chart ever sums tokens across models. A million Haiku tokens and a million Opus tokens differ by more than an order of magnitude in cost, so a bar or line that merges them is a confidently wrong ranking. Whenever the label axis is not the model, the chart splits into one series per model instead. The tables do state a cross-model total, because the number is what you came for — and they neutralise the hazard in place by putting the model mix on every row.
Token counts in the tables are order-of-magnitude; full precision lives in the headline. Body cells and the 合计 footer print as 462.5K / 473.6K (ARC #3948, with the footer following when #4164 closed), while head counts — calls, active users — stay exact everywhere: compacting a head count (5,000 vs 5,400 calls) saves three characters and drops information the reader needs. For exact token totals, read the headline; it prints the same numbers through the same formatter and still says 473,639.
The two tables foot to the same grand total, and to the headline. That is the page's self-check: if 按模型 and 按应用 disagree, they are reading different data. Compaction does not break the invariant — it keeps it as an exact equality: footer === compact(the total the headline prints).
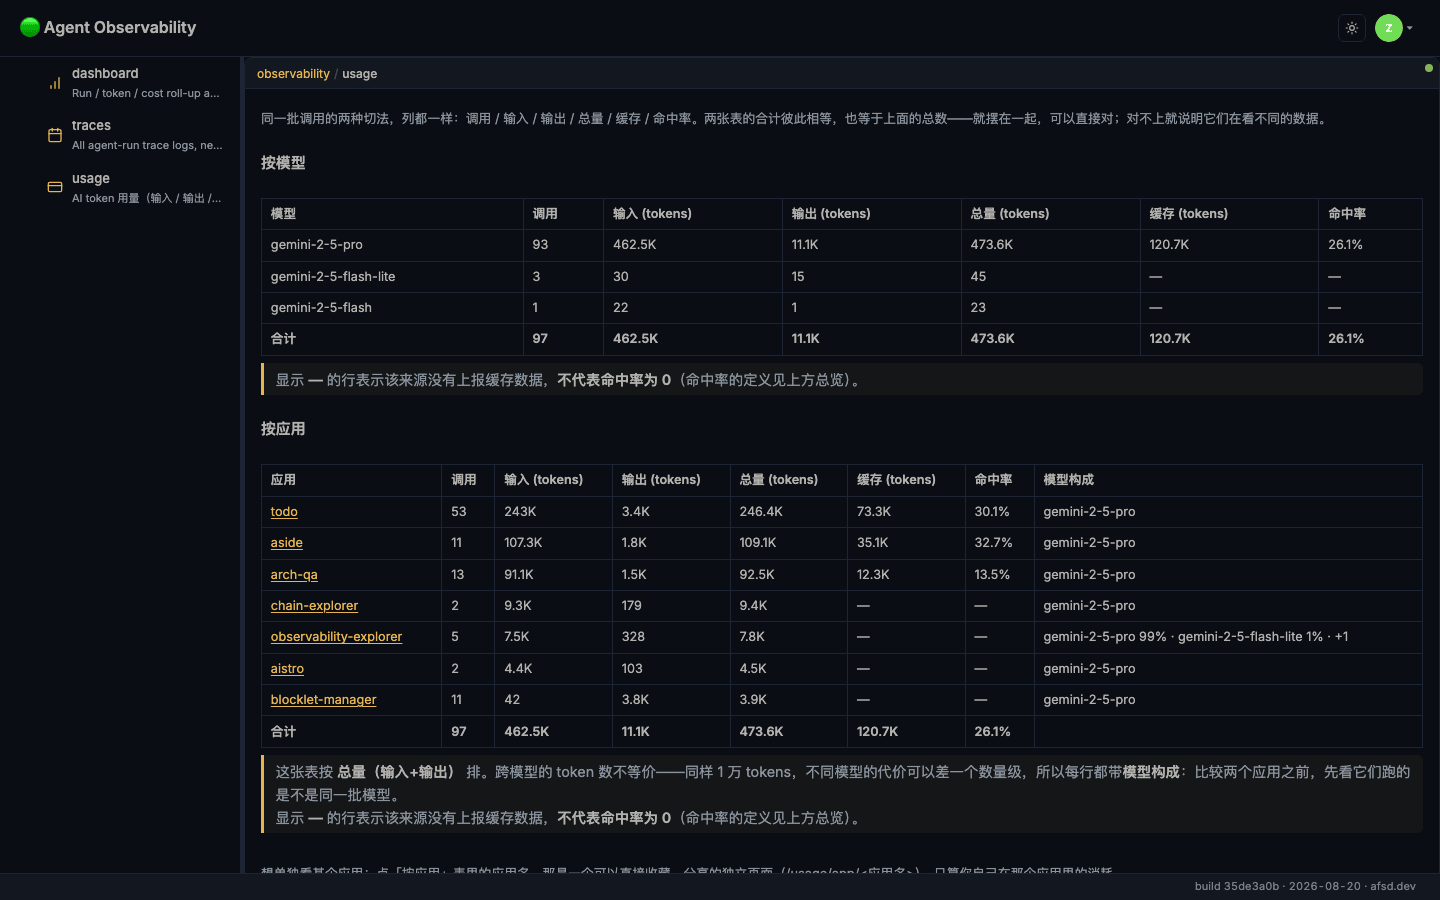
Days with no calls are omitted, not zero-filled. The trend axis in the screenshot jumps 08-06 → 08-08; there was no call on 08-07. Read gaps as absence, not as zero.
One app, on its own page
Every app name in 按应用 is a link to a shareable page for that app alone:
/usage/app/<caller> e.g. /usage/app/todo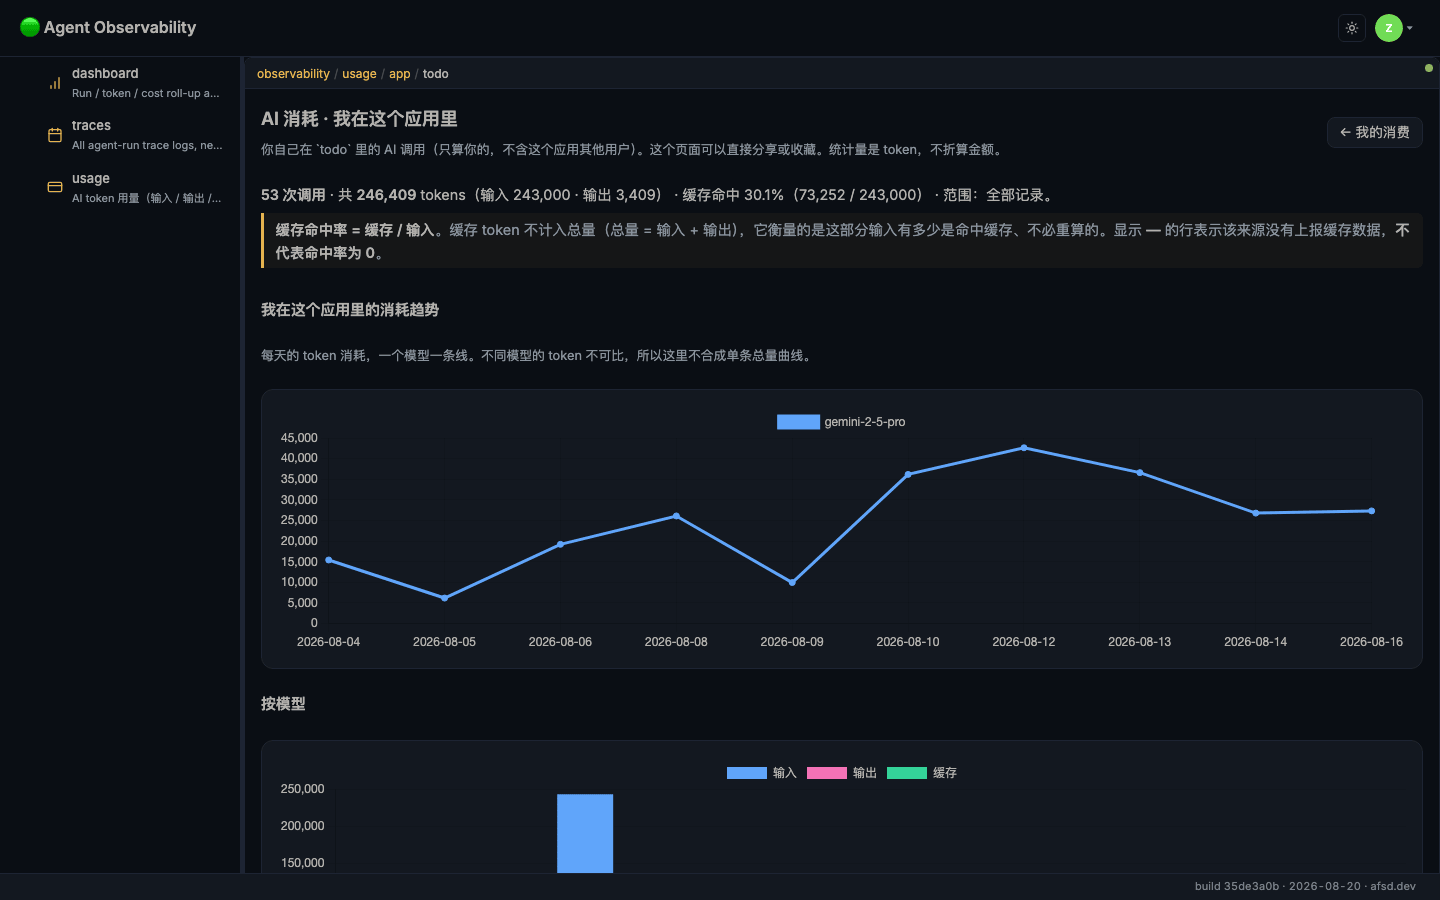
This is your consumption inside that app — not the app's total. Its headline reconciles exactly with that app's row on /usage: in the walk above, todo showed 53 calls / 246,409 tokens in both places. The page carries ← 我的消费 back to the full roll-up.
Its panels are daily, by-model and table-by-model only. by-caller and by-instance are deliberately absent: a population already narrowed to one app draws a single bar on either.
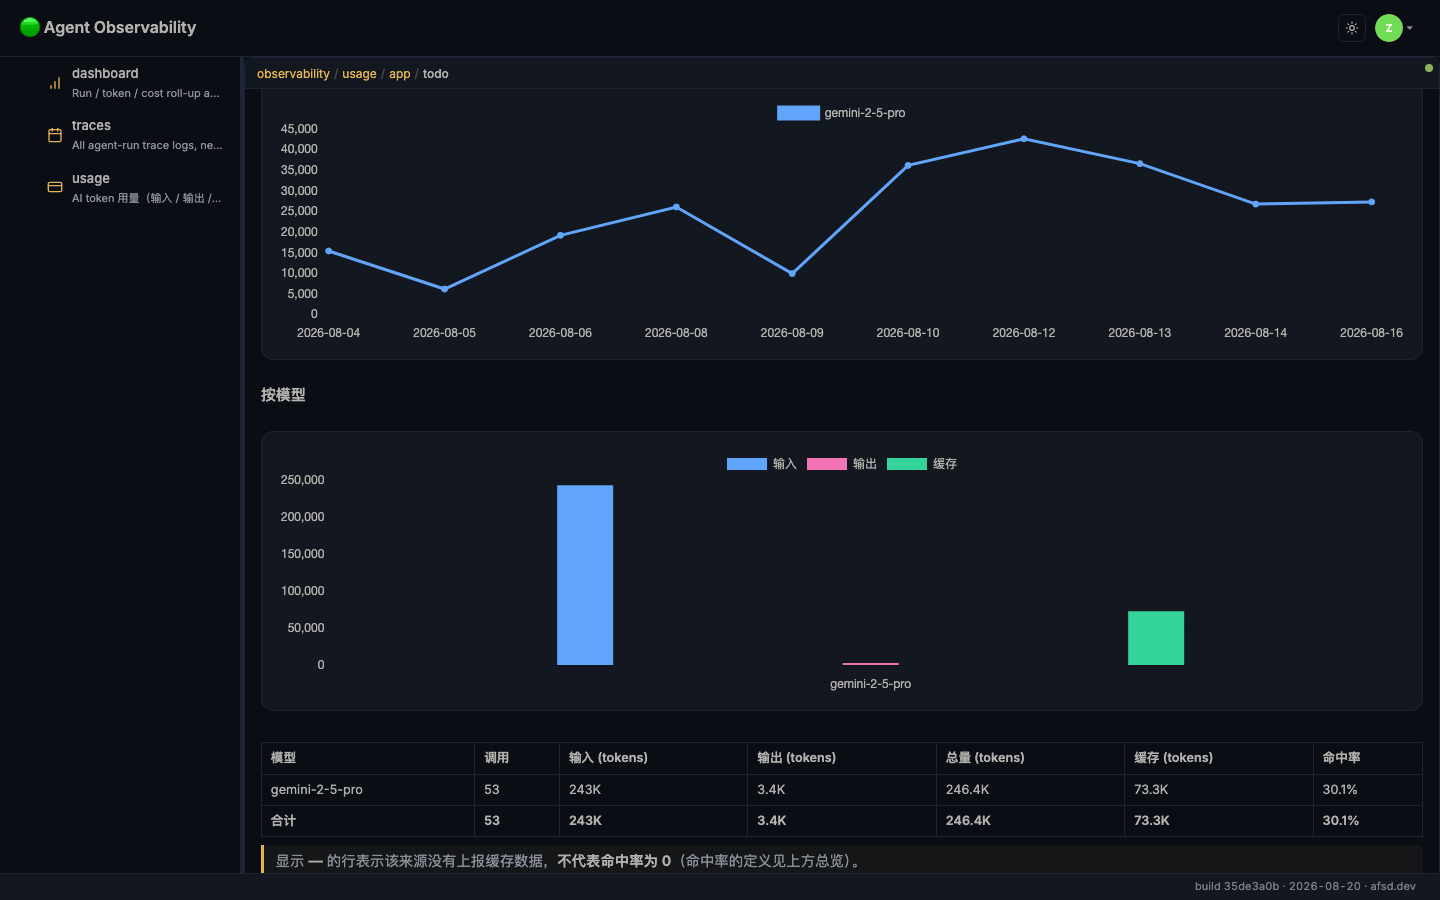
One rendering caveat, visible above: when input and output differ by two orders of magnitude — 243,000 against 3,409 here — the output bar is a hairline against an axis scaled to the input. The number in the table is the reliable read.
The admin face: /usage/admin
Visible to admin/owner callers only. Where /usage reads your ledger across all apps, this reads one app's ledger across all users — a different population, which is why the two are separate pages rather than tabs, and why their totals are not meant to be compared.
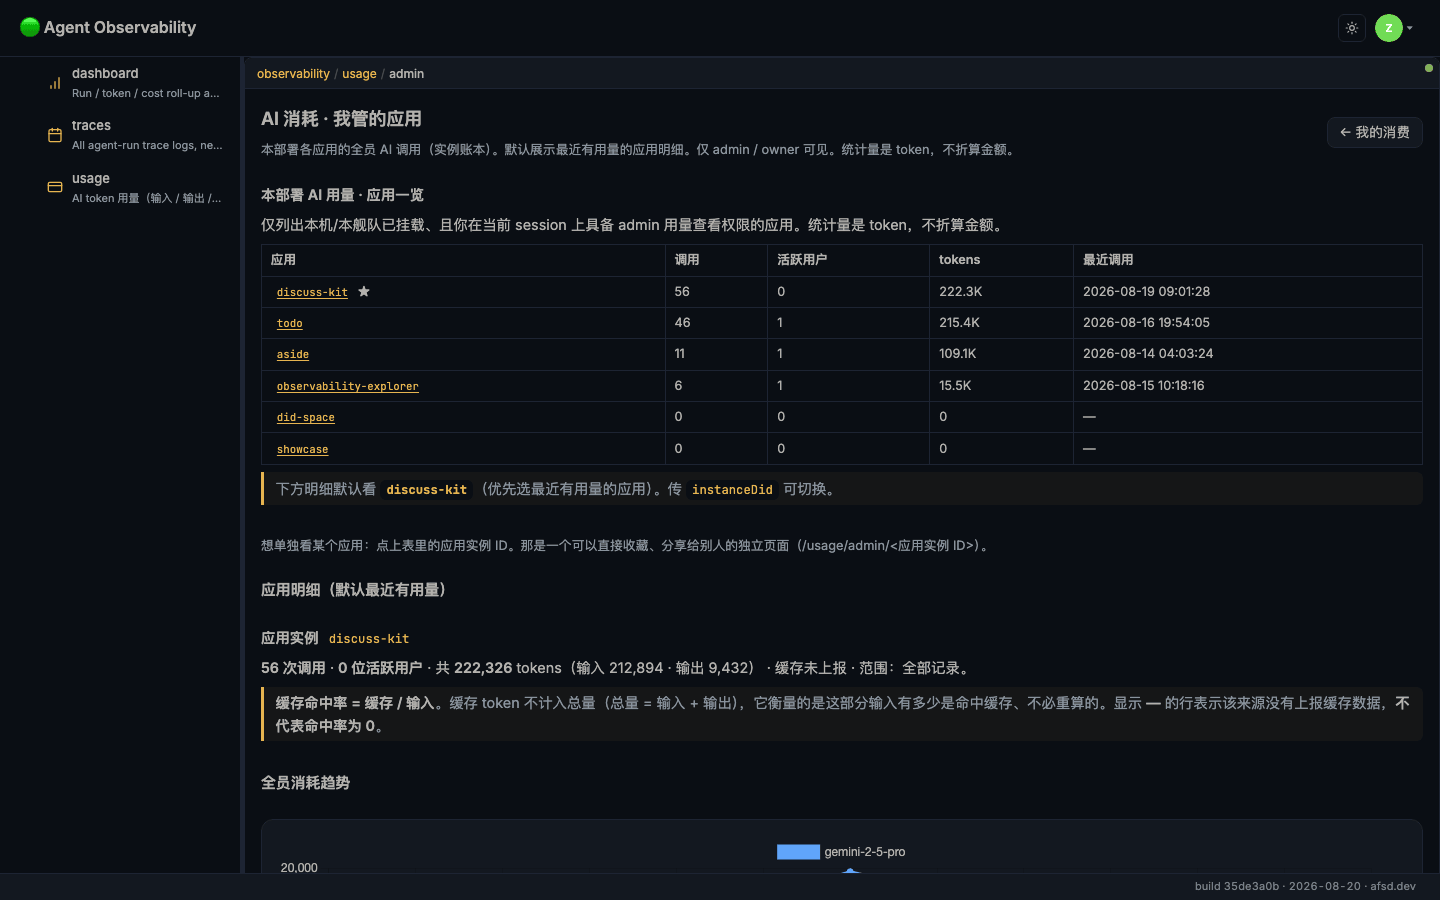
| Block | What it states | Bound to (under /dev/ai/usage/admin/) |
|---|---|---|
| 应用一览 (portfolio) | One row per app you may inspect: calls, active users, tokens, last call | apps |
| Detail below it | The full breakdown for one app — headline, trend, by-user table, by-model table | <projection> |
The app shown in the detail block moves. It is "the authorized app with the newest activity" — marked with ★ in the portfolio — so a link to /usage/admin shows whoever was busiest most recently. To address one app stably, use its own route.
Rows with zero calls belong there. The portfolio lists apps you may inspect, not apps with usage: did-space and showcase are all zeros above. In the other direction, blocklets published through DID Space were missing from this table entirely until ARC #3950 — the enumerator walked only the static registry leg — so on a build older than 2026-08-16 this table is short.
Scroll past the portfolio and the detail block reads like the personal face, with 按用户 where the personal face had 按应用:
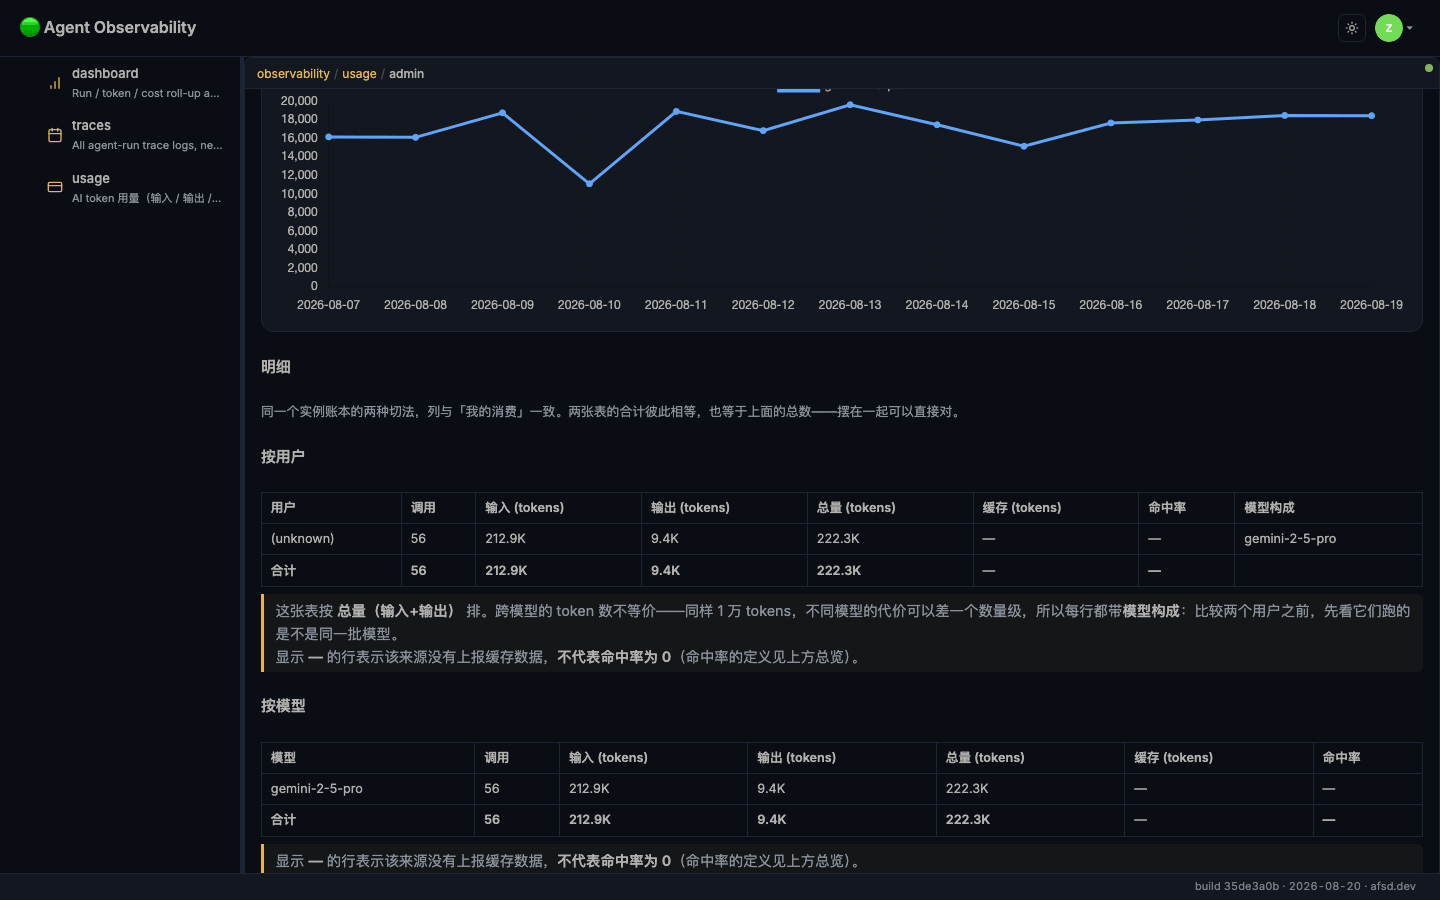
The (unknown) row above is 56 calls that carry no user id — the same records that make the portfolio say "0 active users" for discuss-kit.
One app, and one user in it
/usage/admin/<instanceDid>                 e.g. /usage/admin/discuss-kit
/usage/admin/<instanceDid>/u/<userDid>     one user's consumption inside that app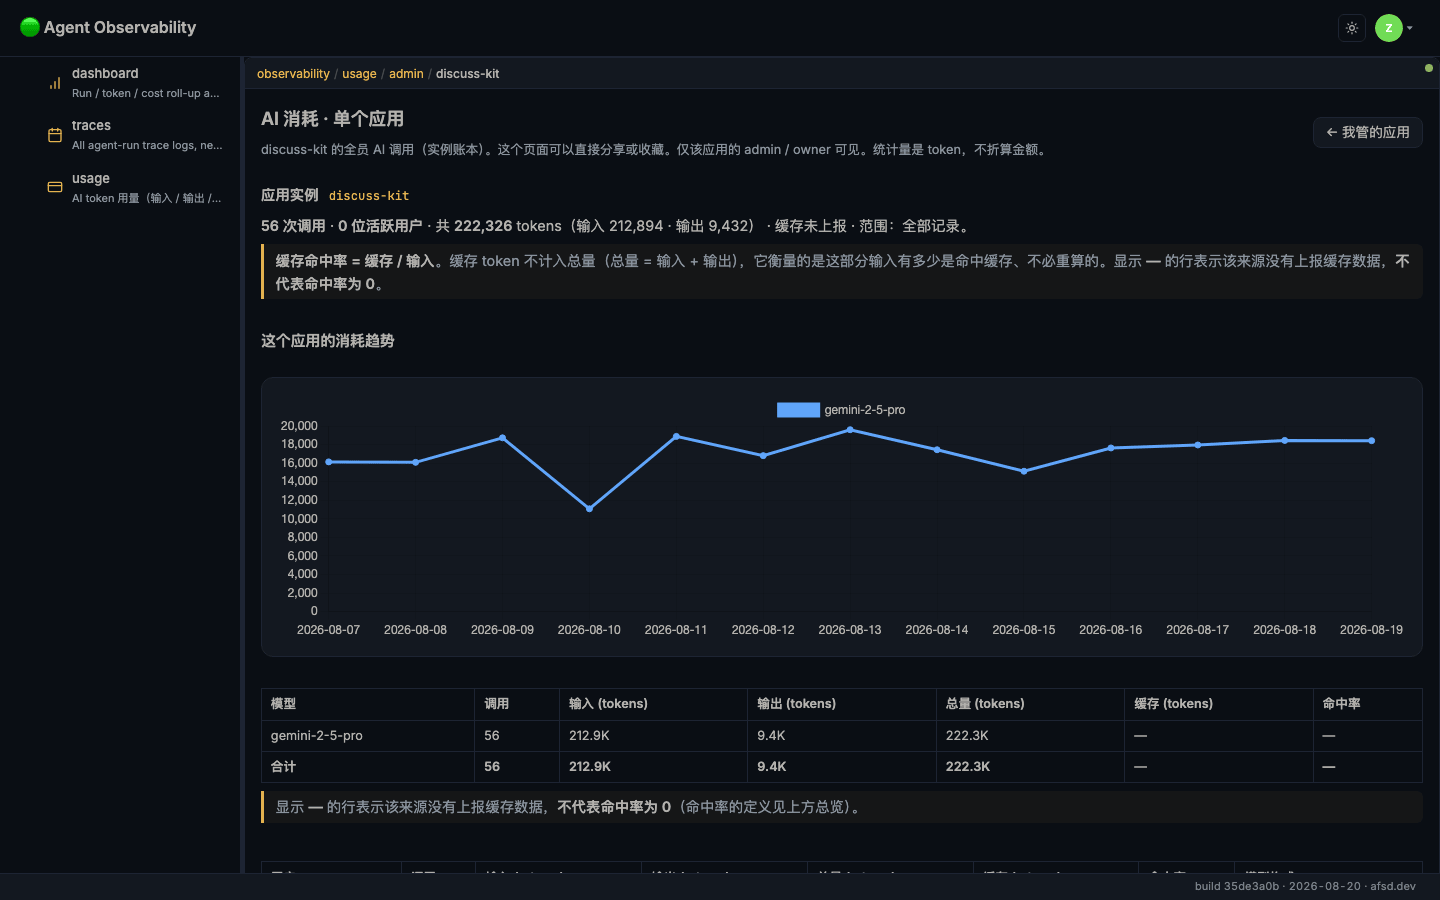
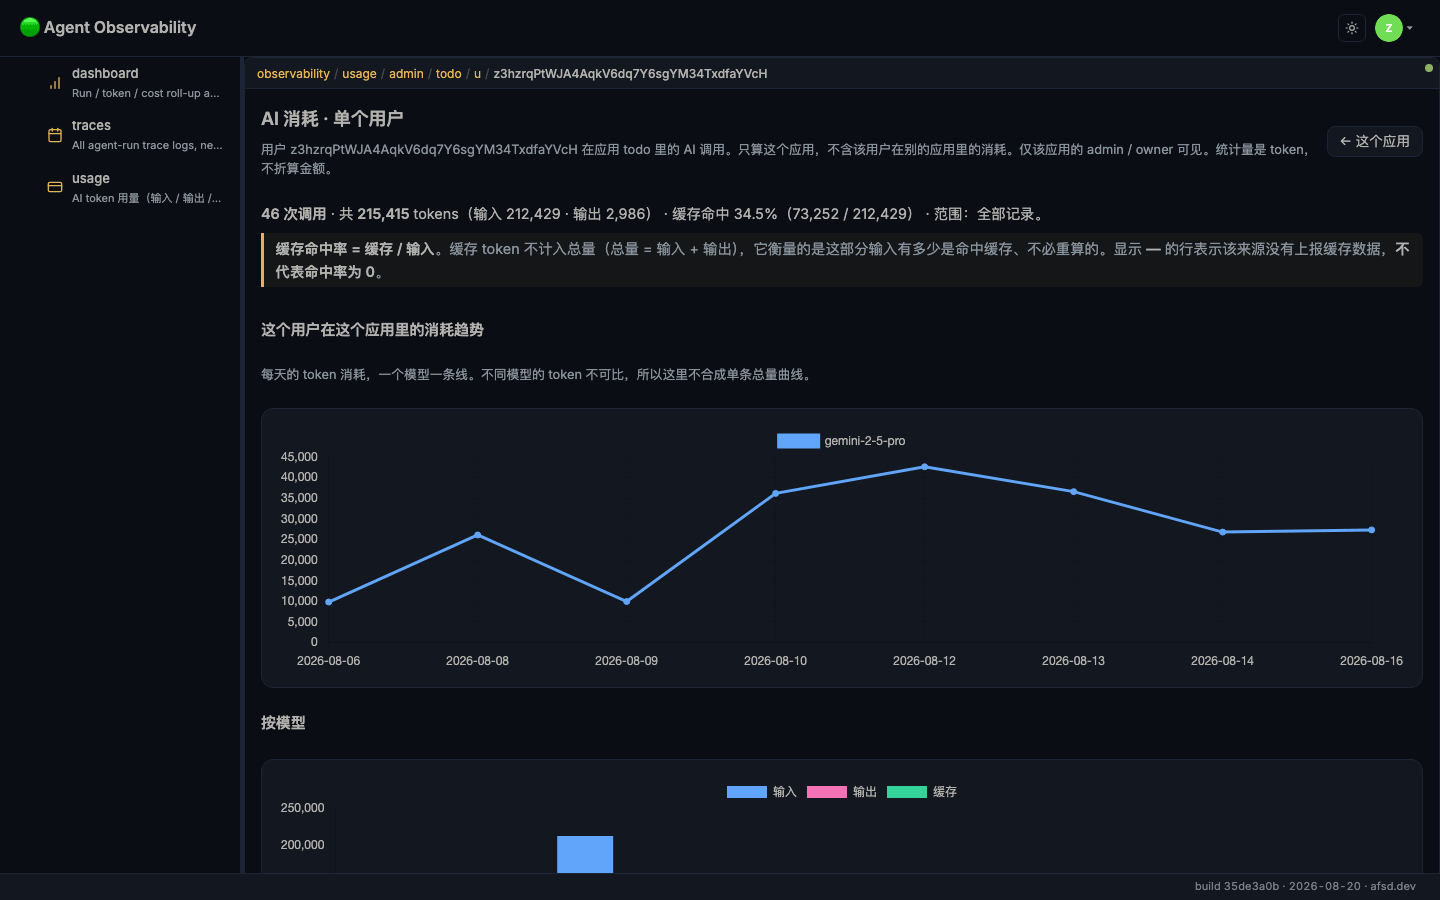
Both are hard-loadable and shareable; the portfolio table's app ids and the by-user table's DIDs are the links that reach them. A row attributed to (unknown) is not a link — see below for what that row means. (The DID in the screenshot belongs to a registered test-fixture account on the test deployment.)
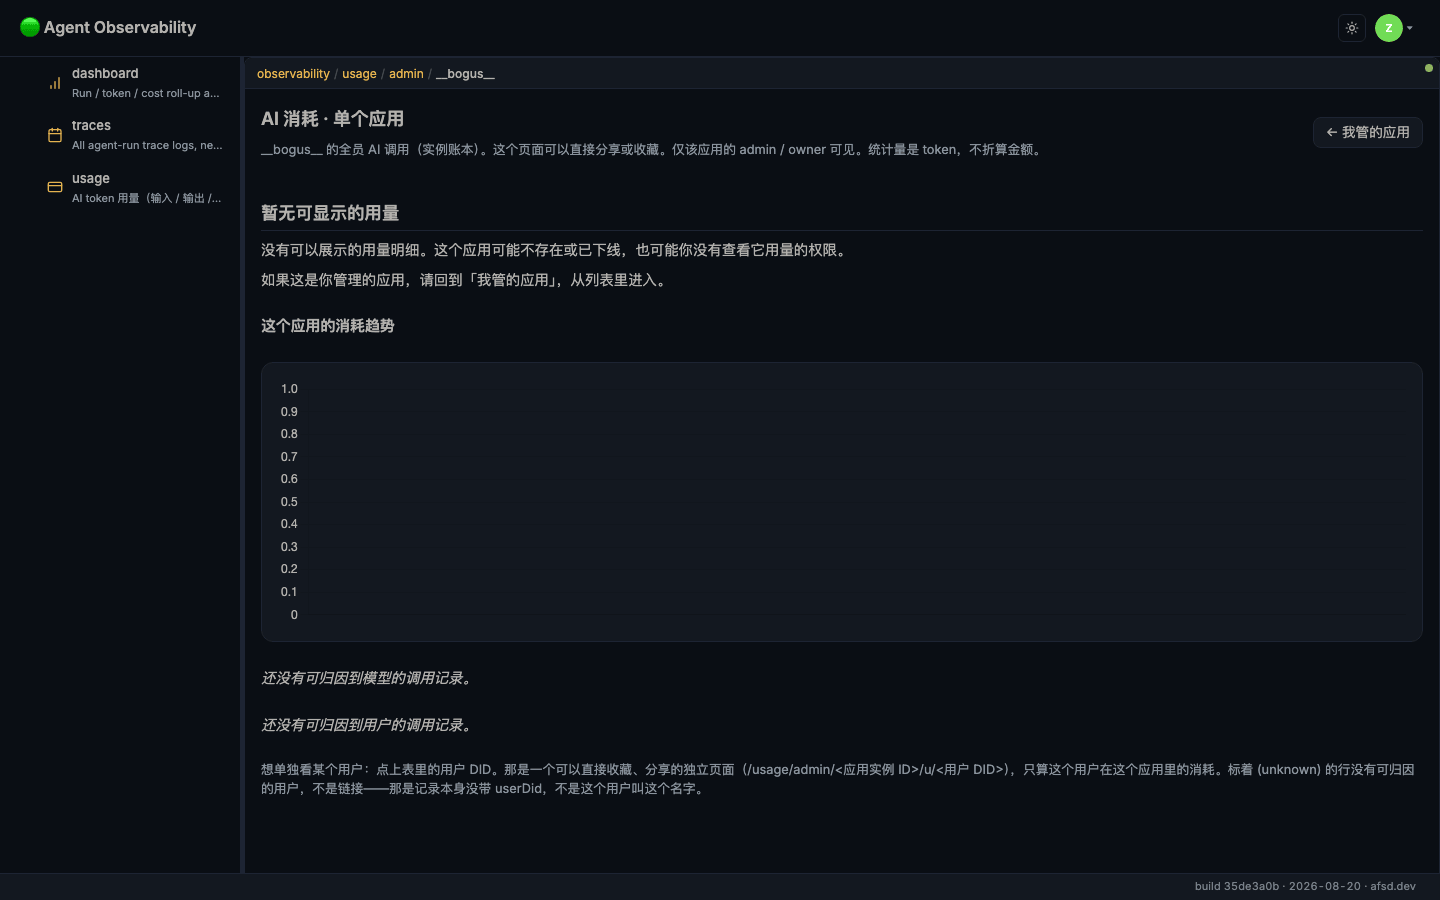
An app id that does not exist — or that you may not view — reaches the same page shape with an honest empty state rather than an error or a zero row:
Integrate against the same data
Every panel above is bound to a readable AFS path. Nothing on the page holds a private copy of the roll-up, so anything the page can show, your own surface can read.
Readable projections
read /dev/ai/usage/<projection>| Projection | Type | Content |
|---|---|---|
summary | markdown | Headline sentence + cache definition + completeness warnings |
table-by-model table-by-caller table-by-instance | markdown | Breakdown tables (same columns on every dimension) |
daily by-model by-caller by-instance | JSON | {labels, datasets} — Chart.js-shaped, bindable as-is |
Per-app: /dev/ai/usage/app/<caller>/{table-by-model,daily,by-model}.
Admin: /dev/ai/usage/admin/{summary,apps,table-by-model,table-by-user,daily,by-model,by-user}, plus /admin/<instanceDid>/<projection> and /admin/<instanceDid>/u/<userDid>/<projection>.
An unknown projection name is an error, not an empty result:
read /dev/ai/usage/table-by-user
→ unknown usage projection "table-by-user" — expected one of
  summary | table-by-model | table-by-caller | table-by-instance |
  daily | by-model | by-caller | by-instance
The admin/ segment does not behave that way. /dev/ai/usage/admin/<x> treats an unrecognised <x> as an app id, so a mistyped projection under admin/ returns the "no usage to show" empty state instead of the error above. Under admin/, check your spelling yourself.
Why projections exist at all
An AUP chart node binds live data through node.src, and node.src must be a readable AFS path — an exec action cannot be bound (providers/runtime/ui/src/aup-registry.ts). Without a readable projection, a page would have to call window.afs.exec() itself and inject the result, which is the renderer-purity violation ARC forbids. That is the whole reason each drill level ships another set of readable routes rather than one clever query.
Practical consequence when you build on this: plan a readable path for every panel you want to bind. If your data only exists behind an action, the chart cannot see it.
The query action
For anything the fixed projections do not answer:
exec /dev/ai/usage/.actions/query { groupBy, where, from, to, limit, includeCost }
exec /dev/ai/usage/admin/.actions/query { instanceDid, ...same }| Argument | Accepts |
|---|---|
groupBy | type model hub caller instanceDid userDid day — string or array, de-duplicated |
where | Same keys (except day), each a string or string array |
from / to | ISO dates; inclusive lower, exclusive upper |
limit | Positive number (default 100) |
includeCost | true to attach cost estimates where hub pricing exists |
A real call and its real answer, from the browser console of the running app:
await window.afs.exec('/dev/ai/usage/.actions/query',
                      { groupBy: ['day'], where: { caller: ['todo'] } })
// → { groups: [...], totals: { calls: 53, totalTokens: 246409, ... },
//     groupCount: 10, scanned: 53, skipped: 0, groupBy: ['day'], range: {} }
The query is strict by design: an unknown dimension, an unknown where key, an unparseable date, or an inverted range each throw rather than degrade. A misspelled top-level argument throws as well, and the error names the legal set:
await window.afs.exec('/dev/ai/usage/.actions/query',
                      { groupBy: ['day'], filter: { caller: 'todo' } })
// → AFS_VALIDATION_ERROR: unknown argument "filter" —
//    expected one of from | to | groupBy | where | limit | includeCost
That check arrived in ARC PR #4081. Before it, {filter: {...}} was silently ignored and the query answered with the entire unfiltered ledger — and a filter that silently does nothing returns a plausible number. Integrating against a build older than 2026-08-15 means spelling where correctly yourself.
One exemption to know about: _scope_afs is the object capability the runtime stamps onto args before dispatch (WS seam, AUP auto-dispatch, chat, scheduler all do it). It is exempt by exact name, not by a _ prefix rule, so it is not an unknown argument (ARC #4169) while a mistyped _scope_af still errors. Pass it through untouched when you dispatch server-side.
Two ceilings to design around: one query reads at most 5,000 audit records (beyond that the result carries truncated: true and a warning — never a quietly short answer), a chart carries at most 8 series (overflow is dropped and named in warnings, never merged into an "other" bucket) and 60 label points.
Known gaps (verified, not inferred)
These are current behaviours of the build named at the top, confirmed by walking it — not speculation.
The two faces can disagree about the same person in the same app. They read two different ledgers: /usage reads your DID Space records, /usage/admin reads the app instance's own ledger. On this walk (08-20) todo reported 53 calls / 246,409 tokens on the personal face and 46 calls / 215,415 tokens for the same single user on the admin face; observability-explorer went the other way (5 personal, 6 admin). Five days earlier the same pairs were 48 / 41 and 4 / 5 — the gap grows with new traffic; it is not a one-off historical residue. The gap is not a rounding artefact — the missing records cluster on the earliest days, and records written without a userDid never enter the per-user view at all. Treat each face as authoritative for its own question and do not subtract one from the other. Tracked in ARC #4082.
(unknown) is a real bucket, not a user. A call whose record carries no userDid is counted in the totals and lands in an (unknown) row. An app can therefore show 40 calls and 0 active users at the same time — that is what discuss-kit shows in the screenshot above. It means "nobody was attributable", not "nobody called".
table-by-instance duplicates table-by-caller on most deployments. instanceDid only diverges from caller where the host supplies a distinct instance identity; on afsd.dev today both are the blocklet id, so the two tables are identical. The page binds only one of them on purpose.
No money, anywhere. Every face counts tokens. Cost estimates exist only behind exec … {includeCost: true} and only where a hub publishes list pricing; no page converts tokens to a currency, and none of them is a bill.
Being signed in is not the same as being an admin. The 我管的应用 → button and the whole /usage/admin face are gated per app, by same-instance admin/owner or membership. If you can sign in but see no admin face, you administer no app on that deployment — the page cannot tell you who does.
The trace face only came under the same rule on 2026-08-18. Before that, authorizedView mapped an owner/admin role on any app to deployment-wide privilege, so one app's owner could read every app's agent runs (task text included) while the same caller was refused per instance by this usage admin face — two faces, two answers about one person. Fixed in ARC #4170 / PR #4269, which moves the predicate into @aigne/afs so it exists once. For what the trace face shows today, see the dashboard page.
Failures to expect
| Symptom | What it actually is |
|---|---|
| "Sign in to view this content." | Not an error — the usage face has no anonymous projection |
| A gap in the trend axis | No calls that day; days without records are omitted, not zeroed |
— in a cache column | That source reported no cache data. Not a 0% hit rate |
| Admin detail block shows a different app than last time | It follows "most recent activity"; use /usage/admin/<instanceDid> for a stable link |
A shared /usage/admin/<app> link shows "暂无可显示的用量" | The app does not exist, is retired, or you may not view it — the empty state does not distinguish them |
A query answers unknown argument "…" | A top-level argument name is misspelled (filter, wehre…); the error lists the legal set |
| A filtered query returns suspiciously round totals | You are on a build before ARC #4081, which ignored a misspelled top-level argument; compare scanned against totals.calls |
See also
- Search and query — how
list,queryandsearchdiffer across AFS - Reference applications — the other bounded examples under
blocklets/